Written by Sally Wolgin
The 3 Red Flags that Predicted Santa Anna's Closure
A Post-Mortem Using Peer Analysis and Call Report Data
Disclaimer: This article is based solely on publicly available data and regulatory filings. I do not have any non-public or insider information about Santa Anna National Bank. Any opinions or interpretations expressed here are my own and should be considered informed conjecture—not verified fact. Readers are encouraged to independently verify any conclusions before relying on them.
When a bank fails, it rarely happens without warning. The signs are often buried in plain sight, embedded in call report data and only visible when viewed through the right lens. While headline metrics like ROA or credit quality may look sound, peer comparisons often uncover deeper issues hiding beneath the surface.
That was the case with Santa Anna National Bank, a small Texas-based institution closed by the OCC in June 2025 for unsafe and unsound banking practices. On paper, the bank appeared healthy. It was profitable, met capital requirements, and showed low levels of delinquency. But when evaluated against its peers, the story changed.
To assess Santa Anna’s true performance, we compared it to four relevant peer groups:
-
The FFIEC National Peer Group (National) includes banks with similar asset size and branch count, serving as a standard regulatory benchmark.
-
The State Peer Group (State) includes all Texas-based banks and offers insight into local economic and competitive dynamics.
-
The LakeHouse Benchmark Peer Group (Benchmark) is based on ownership type—stock or mutual—and grouped by asset size. This approach reflects the reality that profitability expectations differ depending on a bank’s ownership structure.
-
The “Banks Like Me” Peer Group (Like Me) is a custom nationwide group matched by total assets, deposits, and loans. It is designed to reflect banks with similar balance sheet structures.
Through this lens, three key red flags emerged. Viewed individually, they might look like quirks. Viewed together, they formed a clear and troubling pattern.
Red Flag 1: Peer Rankings Showed Persistent Decline
Santa Anna remained profitable through early 2025 and, in fact, ranked in the top 20 percent of banks in its Benchmark Peer Group for profitability.
However, when you look beyond the bottom line, cracks begin to show. The bank’s performance in the other four core categories: Liquidity, Capital, Revenue and Expense, and Credit, had been steadily declining over time. Compared to its peers, Santa Anna was not keeping pace. It was falling behind.
Two key indicators illustrate the divergence:
-
Its Tier 1 leverage ratio stood at 8.62 percent in March 2025, down from 10.94 percent in December 2017. This was still above the regulatory minimum but below average for all four peer groups. While Santa Anna’s capital cushion was shrinking, average values for each group were trending upward, suggesting Santa Anna was out of step with broader risk management improvements in the industry.
-
Santa Anna’s short-term non-core funding to total assets ratio stands at 14.62 percent. While still within regulatory limits, this places the bank in a cautionary zone for liquidity risk. For small rural community banks, a ratio between 5 and 10 percent is generally considered healthy. Once this figure approaches or exceeds 15 percent, it signals elevated dependence on volatile funding sources and a higher level of liquidity risk.
By comparison this same metric is notably lower among Santa Anna’s peer groups:
-
- FFIEC Peer Group: 8.13%
- State Peer Group (Texas): 10.80%
- Banks Like Me: 8.67%
- LakeHouse Benchmark Peer Group: 6.79%
Santa Anna’s elevated reliance on short-term non-core funding stands out as another indicator that the bank was increasingly exposed to liquidity pressure, even as it appeared stable on the surface.
A composite view of Santa Anna’s percentile rankings from the fourth quarter of 2017 through the first quarter of 2025 shows a steady decline across all categories, except profitability.
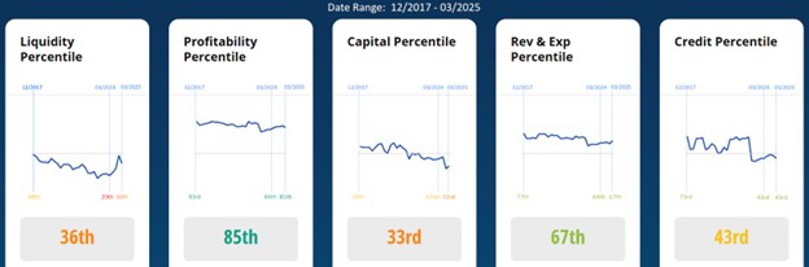
This was not a bank in immediate crisis. But it was a bank gradually weakening while its peers were getting stronger.
Red Flag 2: Deposit Growth Was Extreme and Unmatched by Lending
From March 2024 to March 2025, Santa Anna’s total deposits increased by 33.2 percent. This was a remarkable rise for a rural community bank, especially in a rising rate environment when most small banks were struggling to attract funding.
But Santa Anna was not using those deposits to generate loans. Over the same period, loan balances grew by only 1.9 percent. So where did the new money go?
- Cash Holdings increased by 229%
- "Other Assets" more than tripled
These are categories where accounting inconsistencies and unusual transactions often appear. Across all four peer groups, these same line items showed flat to only modest growth. Santa Anna’s activity stood out as a clear anomaly, with no logical external explanation such as market expansion, acquisition, or a technology initiative.
Interestingly, this rapid deposit growth had the effect of bringing Santa Anna’s March 2025 cash and 'Other Assets' concentration more in line with the peer group averages. In fact, just one year earlier, in March 2024, Santa Anna’s balance sheet was significantly lower in these categories compared to all four peer groups. So, while the jump was extreme, the end result placed the bank’s asset mix closer to peer norms.
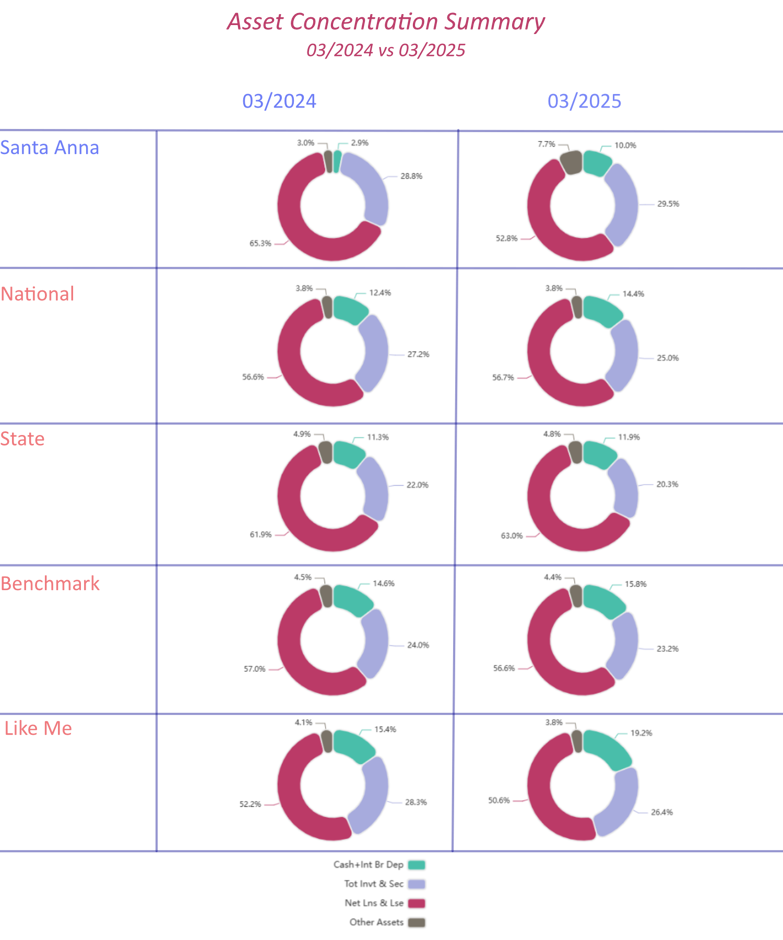
Still, the pace and composition of the shift raised concerns. Healthy banks grow deposits to support lending—but Santa Anna seemed more focused on stockpiling cash and adding opaque assets, casting doubt on whether the growth was genuine or strategically sound.
While the surge in deposits did improve Santa Anna’s liquidity position—highlighted in Red Flag #1—it came at a suspiciously convenient time. Without this sudden influx of cash, the bank’s liquidity stress would have been far more pronounced.
Red Flag 3: Suspicious Timing and Composition of Deposits
The structure and timing of deposit growth raised further concerns.
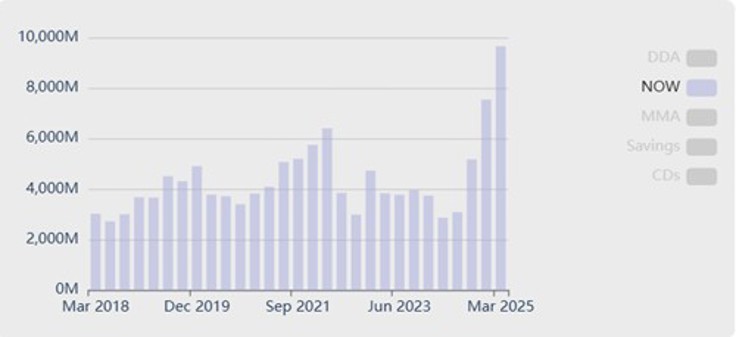
Most of the increase came from NOW accounts, or interest-bearing checking accounts, which:
- Jumped 337% over a single year
- Accounted for 78% of the bank's total deposit growth from March, 2024 to March, 2025
- Reversed a multi-year trend of gradual decline
More troubling was the timing. There was a clear mismatch between quarter-end balances and average balances (Figure 4 – Quarter End vs Average Balance), indicating that much of the deposit growth arrived in the final days of each reporting quarter. This is a common sign of balance sheet window dressing, where a bank temporarily boosts figures for reporting purposes.
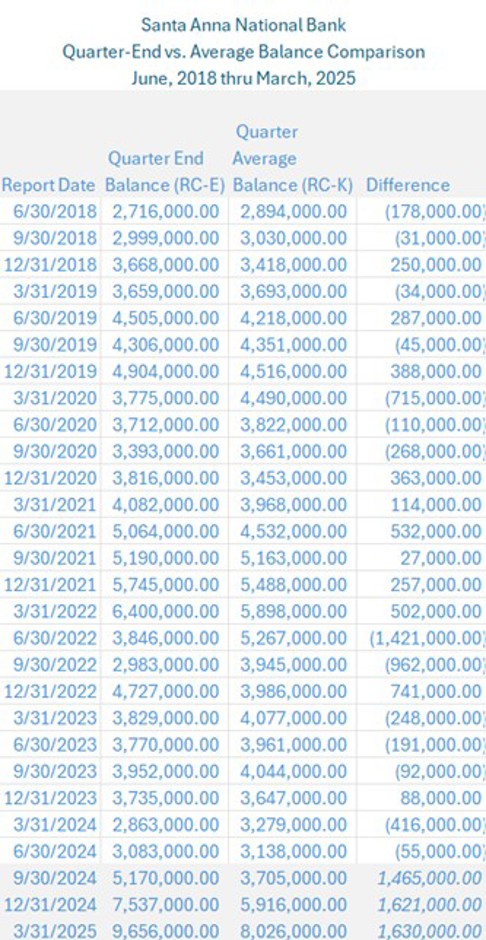
None of this aligned with the bank’s profile. Santa Anna operated in a small rural town, had no public plans for expansion, and offered below-market rates on its NOW accounts, lower than what any of the four peer groups were offering, including the LakeHouse Benchmark Peer Group.

This raises the question: Why would depositors flock to a small-town bank offering uncompetitive rates, unless those deposits were not what they appeared to be?
The Collapse and What It Revealed
In June 2025, the OCC closed Santa Anna National Bank. The FDIC estimated a $23 million loss to the Deposit Insurance Fund—a stunning shortfall for a bank with just over $70 million in reported assets.
Losses of this scale do not happen because of bad luck. They happen when reported assets are overstated, misclassified, or fabricated. In Santa Anna’s case, what looked like a strong performance on the surface masked a much deeper failure of integrity and oversight.
The Lesson: Context Exposes the Cracks
Santa Anna’s failure was not a surprise to anyone who took the time to compare its behavior to similar banks. The warning signs were there, but they were only visible in context.
Compared to its peers across size, geography, balance sheet structure, and governance, Santa Anna’s activity was increasingly abnormal. The combination of:
- A multi-year decline in four out of five key performance categories
- A surge in deposits without corresponding loan growth
- A heavy shift into cash and “Other Assets”
- Suspicious end-of-quarter account activity
- Below-market rates paired with aggressive deposit growth
Suggests manipulation—not disciplined banking.
Bottom Line
Profitability, sufficient capital, and low delinquencies can be deceiving. Without context, they create a false sense of strength.
Peer group analysis is not just a benchmarking exercise. It is a critical risk detection tool. It shows what is normal, what is expected, and what falls far outside the bounds of comparable behavior.
Because when a bank starts acting unlike any of its peers, the question must be asked:
Does the activity make sense or are there red flags in the data?