Written by Hugh Blaxall and Sally Wolgin
How Exposed is Your Bank to Rising Rates?
November, 2022
We haven’t seen rates rise this quickly in at least a decade and quite frankly, many bankers may be unprepared. So, how do you maintain liquidity, control margin compression and stop your customers from chasing higher rates?
Firstly, historical data is vital. It will help you analyze how bank’s profiles have evolved over the past few years. There are numerous ways to get this data, but in this instance, we’re going to be using the LakeHouse Analytics Peer Comparison tool. The nice thing about this peer comparison tool is that not only can you view historical Call Report data of any bank in the country, but you can also display information in an efficient, easy and streamlined fashion. Also, Peer Comparison provides the ability to compare yourself to your competitor’s metrics, thus putting your risk profile in context.
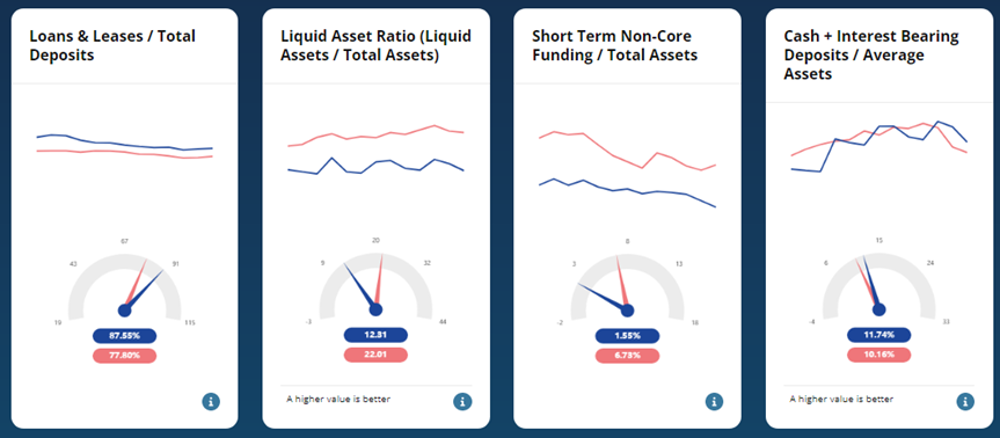
A first group of metrics to look at are those that revolve around Liquidity:
1. Loans & Leases / Total Deposit Ratio: Regardless of your current strategy, if this ratio is above 100 then you are in a risky position and should review your loan growth.
2. Liquid Asset Ratio: A lower value shows that you have less access to immediate cash. We recommend that you keep this number above 15%.
3. Short Term Non-Core Funding: The less Non-Core Funding the better. This funding tends to be more expensive and eats into your available contingency funding.
4. Cash and Interest-Bearing Deposits: Having more of these assets lowers your liquidity risk. Below 3% may indicate your cash reserves are too low.
The second group metrics you should analyze are specific to funding concentrations. These include Demand, Savings, MMA, CD’s, Borrowings, Brokered Deposits, and the cost of each of these funding concentrations. For instance, a high concentration of brokered deposits may be a red flag, since these tend to be expensive and eat into your available contingency funding.
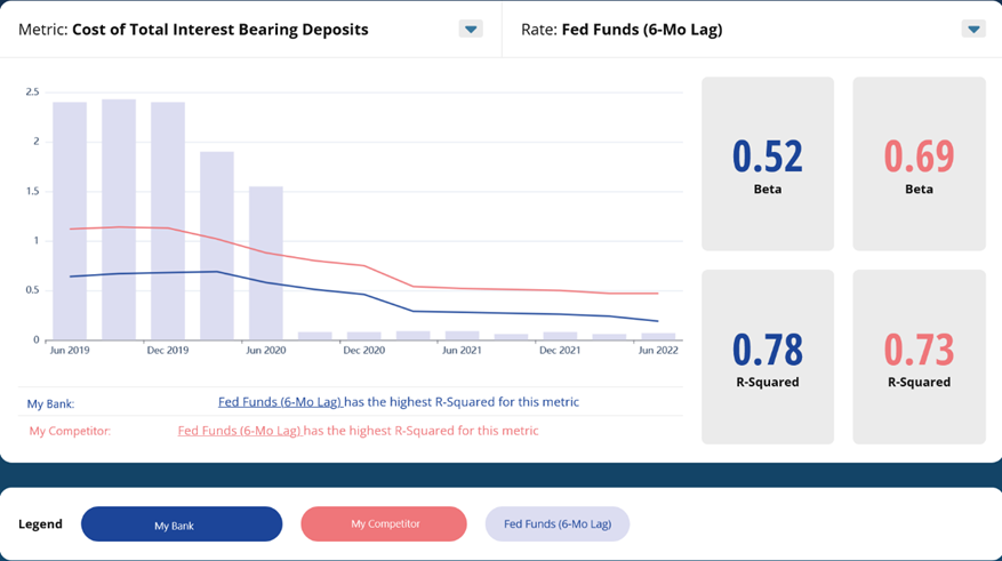
Finally, comparing your funding cost to your peers shows your competitive position and thus the effectiveness of your funding strategy.
Another feature that Lakehouse provides is “Betas”. Betas show the sensitivity of the chosen metric to market rates. The sensitivity of funding types to changes in market interest rates shows how quickly these funding rates will reprice. You can also look at the beta of earning assets and margin; these relationships to market rates help determine prospective profitability. In the current upward rate environment, it will enhance future income if assets quickly reprice upwards while funding costs remain low.
The above metrics provide a quick and easy summary of both you and your chosen competition/peer group. These will help you focus on the necessary strategies to keep your institution profitable and free of liquidity issues. This will ensure your continued success as a community bank and a pillar of your community.
*1 The 2004 – 2006 Rate Cycle is most similar to our current cycle. The average rate increase was 18bps / month. Currently, we are averaging 50bps/month.