Written by Hugh Blaxall and Mark Hengel
Betas are Being Scrutinized by Regulators- What You Can Do Right NOW to Prepare
September 2023
Regulators are analyzing correlation betas more than they have ever done in the past. The value in understanding correlations between rates and your metrics has proved to be a vital tool in predicting risk and return to your institution.
So what are these betas that are making headlines right now? What can they tell us? How can we utilize them to our advantage?
What is a beta?
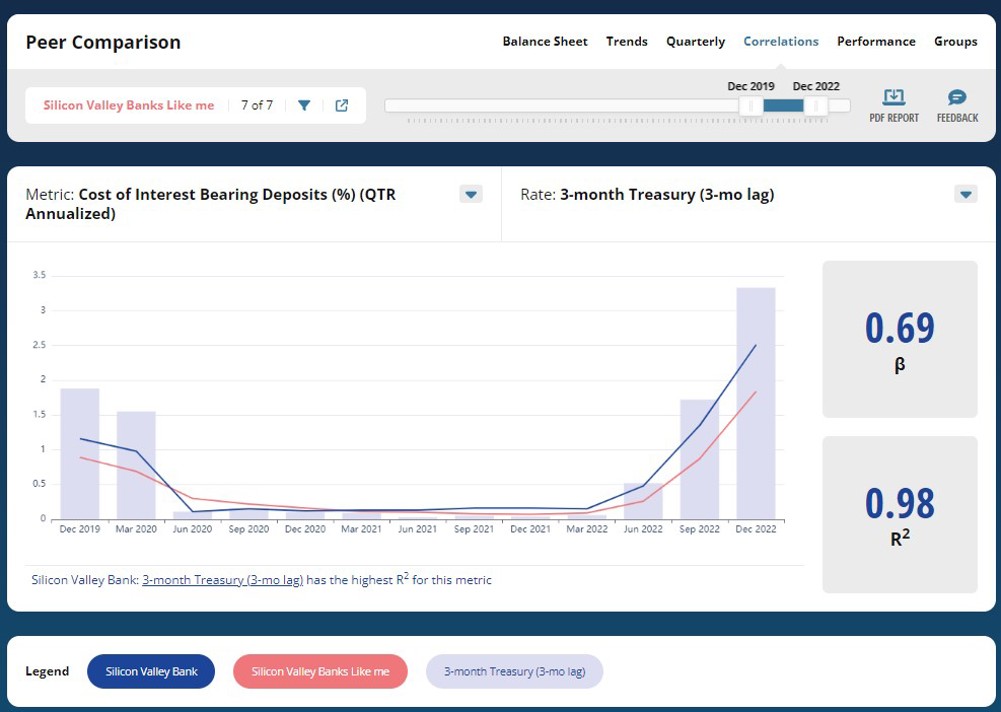
Betas measure the relationship between product rates (e.g. MMAs, Savings, Loans) and market rates. In the example below, I’ve selected the Total Cost of Interest-bearing deposits to the 3 month Treasury (6-mo lag). Your beta shows how correlated your metric is to the selected rate. In the case below, the Cost of Total Interest-Bearing Deposits will rise 69 basis points for every 100 point move in the 3 Month Treasury increases. Another important number that is displayed with your beta is R Squared. This is a measure of “goodness of fit”; it is basically a gauge on how confident we are in that beta. The higher the R Squared, the more accurate the beta.
Monitoring your historical ‘betas’ is essential to gauging future performance.
What does this mean for my bank?
Understanding what beta and R Squared metrics are can be great but not quite applicable. Let’s dive into how we can use these betas and R Squareds to inform your balance sheet and pricing strategies.
Betas can determine if a banks margin is compressing and if so, how quickly this is happening. When your margin increases as rates go up, that’s a sign that you are asset sensitive. When the opposite is true, you are liability sensitive. Notice if you look at your margin over time it may change from being asset sensitive to liability sensitive depending on the profile of your balance sheet and the coincident rate cycle. Understanding these relationships help you better prepare for uncertain future economic conditions and rate cycles.
How can we utilize these numbers?
The first thing you should do when analyzing historical betas is notice that your risk profile may be fluid. You think you may have always been asset sensitive or liability sensitive but once you take a look at your historical metrics, this may not be true. Looking at your betas helps you understand your current and past interest rate risk profile. It is important to pay attention to changes in rates and the economy as they may effect the profile of your balance sheet.
Understanding historical relationships will help you strategize for the future. Nobody can perfectly predict what will happen to rates or the economy, but we can prepare for what may happen. Start strategizing your funding or liquidity plans and run stress tests to determine how to be prepared for the future. Look at potential margin changes, be aware of immediate funding shortfalls and lock in your associated contingent funding.
Analyze the most likely situation and the most stressful situation – suggest the need for funds or liquidity. Of course, ensure that in those situations you are not only making money but that you are also in compliance with your policy.
Regulators are looking to make sure that you have done all these things.
Betas on both sides of the balance sheet are being scrutinized by regulators and examiners. With a potential recession around the corner, margin matters. Regulators want to know your betas and how they apply to your liquidity and interest rate risk.
Prepare yourself for your next exam by having all your metrics and betas at your fingertips with ‘Peer Comparison’. Schedule a demo today and get a free trial of our premium version. Prepare for your future by analyzing the past with Peer Comparison.